Working with TipRanks
Follow Us


Stocks
ETFs
Options
Commodities
Crypto
Currency
Pro Newsletters
Research Tools
Calendars
Economic Indicators
Calculators
Education
About Us
Working with TipRanks
Follow Us
Hims & Hers Health (HIMS)
NYSE:HIMS
Hims & Hers Health (HIMS) Stock Price & Analysis
1,520 Followers
HIMS Stock Chart & Stats
Day’s Range$0 - $0
52-Week Range$5.65 - $21.44
Previous Close$19.42
Volume15.99M
Average Volume (3M)8.43M
Market Cap
$4.17B
Enterprise Value$3.96B
Total Cash (Recent Filing)$221.00M
Total Debt (Recent Filing)$9.95M
Price to Earnings (P/E)―
Beta1.60
Next Earnings
Aug 05, 2024EPS Estimate
$0.05Next Dividend Ex-DateN/A
Dividend YieldN/A
Share Statistics
EPS (TTM)-0.02
Shares Outstanding214,786,086
10 Day Avg. Volume20,372,799
30 Day Avg. Volume8,433,427
Standard Deviation0.19
R-Squared0.08
Alpha0.00985
Financial Highlights & Ratios
Price to Book (P/B)20.39
Price to Sales (P/S)16.25
Price to Cash Flow (P/CF)49.70
P/FCF Ratio24.70
Enterprise Value/Market CapN/A
Enterprise Value/Revenue4.54
Enterprise Value/Gross Profit5.54
Enterprise Value/Ebitda214.67
Forecast
1Y Price Target
$17.69Price Target Upside-8.91% Downside
Rating ConsensusModerate Buy
Number of Analyst Covering10
Hims & Hers Health News


Bulls Say, Bears Say
Bulls Say
Financial PerformanceHims & Hers reported strong Q1 results, with subscribers, revenue, and profitability all coming in ahead of expectations.
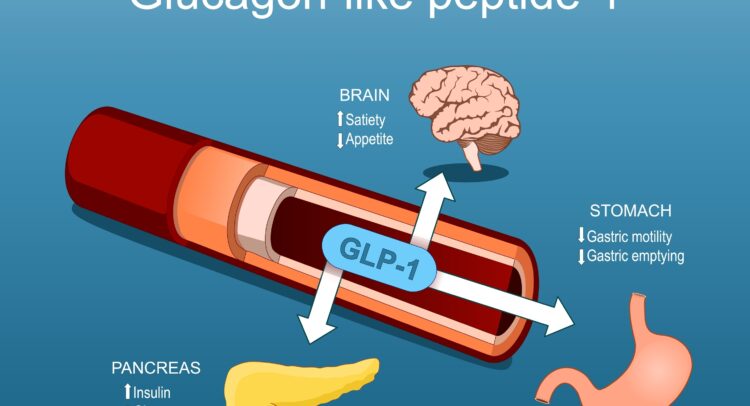
Product LaunchHIMS launched its GLP-1 offering which is expected to significantly increase the interest in its weight loss offering.
Strategic PartnershipsHims & Hers partners with a leading manufacturer, ensuring FDA oversight and accreditation for compounded medications.
Bears Say
Financial PerformanceWith the stock up significantly since the announcement, HIMS has added substantial enterprise value on limited new information, leaving little room for upside.
Market StrategyThe potential challenge for HIMS is what happens after the branded GLP-1s come off the shortage list, creating significant uncertainty around the longevity of this earnings stream.
Regulatory RiskThe program introduces more regulatory / legal risk into HIMS's business model.
---
Ownership Overview
40.00% Insiders
12.94% Mutual Funds
30.37% Other Institutional Investors
16.68% Public Companies and Individual Investors
Risk Analysis
Main Risk Category
Finance & CorporateFinancial and accounting risks. Risks related to the execution of corporate activity and strategy
Website Traffic
The estimated number of people who visited one or more of the websites owned by Hims & Hers Health
Desktop Users
Mobile Users
HIMS FAQ
What was Hims & Hers Health’s price range in the past 12 months?
Hims & Hers Health lowest stock price was $5.65 and its highest was $21.44 in the past 12 months.
What is Hims & Hers Health’s market cap?
Currently, no data Available
When is Hims & Hers Health’s upcoming earnings report date?
Hims & Hers Health’s upcoming earnings report date is Aug 05, 2024 which is in 65 days.
How were Hims & Hers Health’s earnings last quarter?
Hims & Hers Health released its earnings results on May 06, 2024. The company reported $0.05 earnings per share for the quarter, beating the consensus estimate of $0.01 by $0.04.
Is Hims & Hers Health overvalued?
According to Wall Street analysts Hims & Hers Health’s price is currently Overvalued.
Does Hims & Hers Health pay dividends?
Hims & Hers Health does not currently pay dividends.
What is Hims & Hers Health’s EPS estimate?
Hims & Hers Health’s EPS estimate is $0.05.
How many shares outstanding does Hims & Hers Health have?
Hims & Hers Health has 206,408,460 shares outstanding.
What happened to Hims & Hers Health’s price movement after its last earnings report?
Hims & Hers Health reported an EPS of $0.05 in its last earnings report, beating expectations of $0.01. Following the earnings report the stock price went up 6.009%.
Which hedge fund is a major shareholder of Hims & Hers Health?
Among the largest hedge funds holding Hims & Hers Health’s share is Farallon Capital Management, L.L.C.. It holds Hims & Hers Health’s shares valued at 26M.
---
Hims & Hers Health Stock Smart Score
Outperform
1
2
3
4
5
6
7
8
9
10
Analyst Consensus
Moderate Buy
Average Price Target:
$17.69 (-8.91% Downside)
$17.69 (-8.91% Downside)
Blogger Sentiment
Bullish
HIMS Sentiment 91%
Sector Average 69%
Sector Average 69%
Hedge Fund Trend
Increased
By 3.3M Shares
Last Quarter.
Last Quarter.
Insider Transactions
Sold Shares
Worth $2.6M over
the Last 3 Months
the Last 3 Months
Crowd Wisdom
Very Positive
Last 7 Days ▲ 6.8%
Last 30 Days ▲ 28.3%
Last 30 Days ▲ 28.3%
News Sentiment
Very Bullish
Bullish news 100%
Bearish news 0%
Bearish news 0%
Technicals
SMA
Positive
20 days / 200 days
Momentum
117.22%
12-Months-Change
Fundamentals
Return on Equity
-0.72%
Trailing 12-Months
Asset Growth
19.08%
Trailing 12-Months
Company Description
Hims & Hers Health
Oaktree Acquisition Corp. is an emerging growth company, which engages in the provision of merger, capital stock exchange, asset acquisition, stock purchase, reorganization or similar business combination with one or more businesses. The company was founded by Patrick McCaney, Alexander Taubman and Mathew Pendo in 2019 and is headquartered in Los Angeles, CA.
---
HIMS Company Deck
---
HIMS Earnings Call
Q1 2024
0:00 / 0:00
---
HIMS Revenue Breakdown
96.60% Online
3.40% Wholesale
---
HIMS Stock 12 Month Forecast
Average Price Target
$17.69
▼(-8.91% Downside)
Technical Analysis
Best Analysts Covering HIMS
1 Year
1 Year Success Rate
4/4 ratings generated profit
1 Year Average Return
+127.13%
reiterated a buy rating 3 months ago
Copying Jonna Kim's trades and holding each position for 1 Year would result in 100.00% of your transactions generating a profit, with an average return of +127.13% per trade.
---